

MPG After a Remap: Why Yours Did Not Improve, and What Actually Decides It
Most drivers who tell us the economy gain never arrived are measuring against a figure that was never theirs to begin with — and half of them are sitting on a real fault.
This is one of the more awkward conversations in tuning, so it is worth having properly. A driver has an economy-biased file written, drives for a fortnight, checks the dashboard readout and finds the number looks much the same as before. Sometimes that is a disappointing result. More often it is a measurement problem, a driving problem, or a fault nobody has looked for yet.
Why did my MPG after a remap not improve? Usually because it is being compared against the brochure figure rather than a real before-and-after, or because the extra low-down torque is being used rather than saved. A remap can reduce the throttle needed for a given speed; it cannot reduce what your right foot, your route, your load and your tyre pressures cost you.
Here is what we check, in the order we check it, when someone tells us the economy gain never showed up.
The brochure figure was never your figure
The MPG number attached to your car is a published test result, not a measurement of your driving. You can look yours up through the government’s official car fuel consumption and CO2 emissions data, held by the Vehicle Certification Agency, for anything registered from March 2001 onwards.
Those figures come from a standardised laboratory procedure run to a fixed drive cycle. That is the entire point of them: they let two different cars be compared on identical terms. What they are not is a prediction of what a specific vehicle will return on the A50 in February with four people and a boot full of tools.
The gap is recognised officially, too. The Vehicle Certification Agency is the body government points you to if your vehicle is not meeting its stated consumption performance, or if you want the difference between WLTP and the older NEDC test results explained. If a vehicle can fall short of its own published figure before anyone touches it, comparing a post-remap tank against that figure tells you nothing about the remap.
The one that catches nearly everyone: a quoted MPG figure for the same model may have been measured under a different test procedure depending on when it was registered. Two numbers for “the same car” are not always comparable with each other, never mind with your commute.

How to measure economy honestly
If you want to know whether a file changed anything, you need a comparison that can survive being questioned. Trip computers are calculated estimates and they drift, particularly after a software change.
- Brim the tank to the same point at the same pump, twice, and divide miles covered by litres put in. Convert to miles per gallon if you prefer — the units matter less than the method.
- Use three tanks, not one. A single tank contains one week of weather, traffic and errands. Three smooths that out.
- Keep the route the same. A motorway week and a school-run week are different vehicles as far as fuel is concerned.
- Write down the load. Roof bars on, boot full, three passengers — note it, because you will forget.
We do exactly this when measuring fleet work, and the method is the whole reason those results hold up: there is more on it in our write-up on measuring MPG properly across a van fleet.
Six things that move fuel consumption more than a map does
None of this is glamorous, and all of it outweighs a calibration change on most vehicles.
Tyre pressures
Soft tyres cost fuel continuously, every mile, in a way you never feel. Check them cold against the laden figure on the door pillar, not the unladen one.
Short, cold journeys
A diesel that never reaches full operating temperature is running rich, is not regenerating its filter properly, and will show you a poor average no matter what is in the ECU.
Weight and aerodynamics
Roof bars, a loaded van, a towbar-mounted cycle carrier. Drag rises sharply with speed, so an empty roof rack is costing you most on exactly the journeys where you are watching the figures.
Cruising speed
The difference between 65 and 78mph on a long run is larger than almost any software change. If you gained torque and used it to sit faster, your consumption was always going to rise.
Idling and short-cycle air conditioning
Sitting on the drive warming up, long waits with the engine running, the climate control fighting a cold cabin twice a day. It all lands in the same average.
The right foot
The honest one. A file that gives you useful pull at 1,800rpm is very easy to enjoy, and enjoying it is not free.
What an economy-biased file genuinely does
A calibration written for consumption rather than headline output works by reducing how hard you have to ask for a given result. More torque low in the rev range means a given road speed needs less throttle, fewer downshifts and less time at high revs.
On the vehicles where that pays off most, the pattern is consistent: high annual mileage, a lot of steady A-road and motorway running, a load on board, and a driver whose habits do not change afterwards. Vans and tow vehicles fit that description far better than a car doing six miles a day.
Where it pays off least is urban stop-start driving, short trips, and any situation where the available torque simply gets used. That is not a flaw in the file. It is what the file is for. Our longer explanation of the mechanism is in our guide to how tuning affects fuel consumption, and you can sanity-check expectations for your own engine with the remap estimate tool before booking anything.
Our position, stated plainly. We will not quote you a guaranteed MPG gain, because nobody honestly can — it depends on the engine, its condition and who is driving it. What we will do is tell you before you book whether your mileage profile makes an economy-biased file worth the money at all.
When flat economy is a fault, not a disappointment
This is the part worth taking seriously, because a stubbornly poor average is one of the earliest symptoms of several common diesel faults. If consumption has genuinely got worse rather than simply not improved, look for a cause before blaming the calibration.
| What you notice | Common cause worth checking | Where it usually shows up |
|---|---|---|
| Consumption worse, engine feels normal | Partially blocked filter forcing frequent regeneration attempts | Short-journey vehicles, often with no warning light yet |
| Worse economy plus a flat spot | Boost leak, sticking turbo actuator or a tired sensor | Under load, most obvious on gradients |
| Rough running and poor average | Injector or EGR fault; carbon-fouled intake | Cold starts and low-speed running |
| Sudden step change after a service | Wrong oil specification, or a sticking brake caliper | Immediately after the work, not gradually |
| Fine on motorways, poor around town | Usually not a fault at all — journey profile | Consistent for the life of the vehicle |
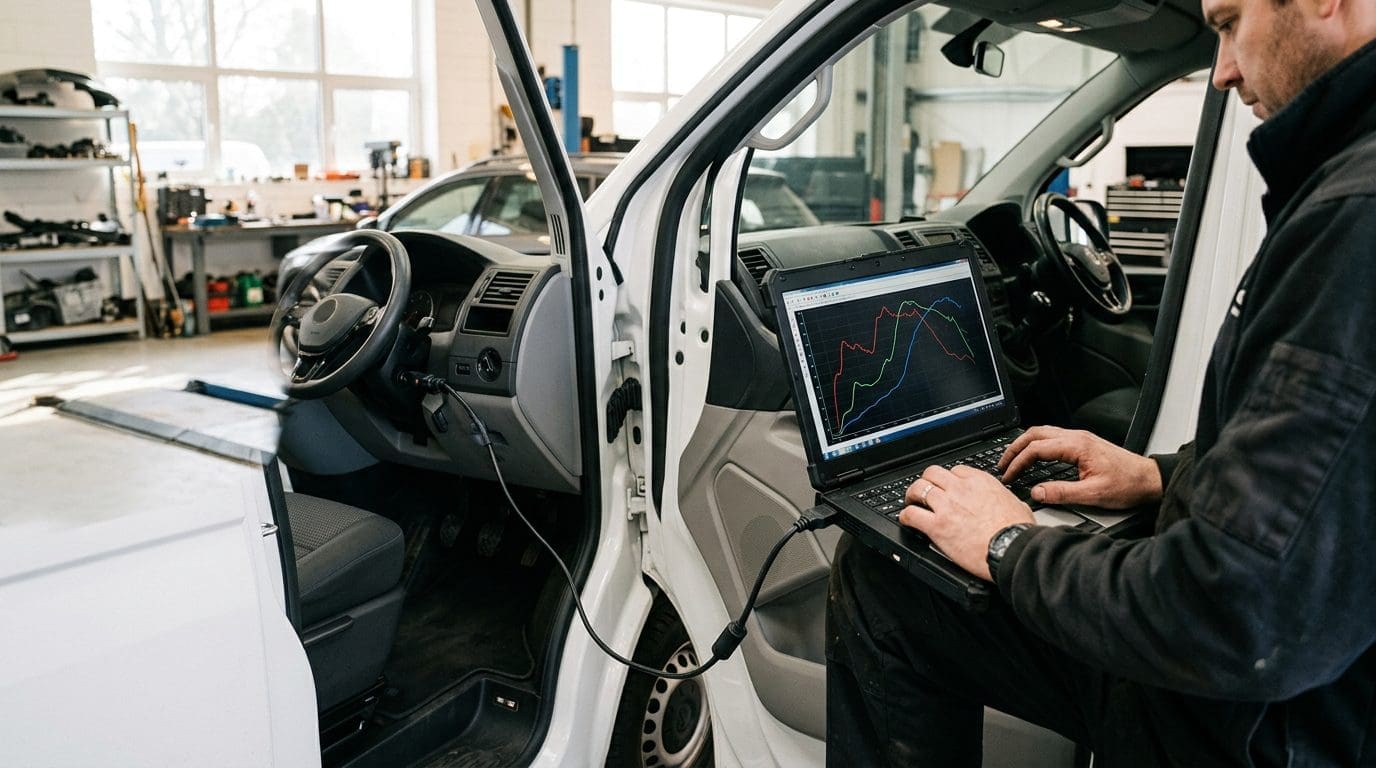
A diagnostic session costs a fraction of chasing the wrong answer. If the figures have moved in the wrong direction, that is where we start — and our notes on how tuned diesel vans behave in daily use cover what normal actually looks like over a working year.
Common questions
How long does it take to see an MPG change after a remap?
Allow three full tanks measured brim to brim on your usual route. Anything shorter is measuring the week, not the vehicle. Reset the trip computer if you like, but treat its number as a guide rather than evidence.
Can a remap make fuel consumption worse?
Yes, easily — if the extra torque gets used. The same file can improve consumption for a driver who keeps their habits and worsen it for a driver who enjoys the new response. The calibration changes what is available, not how you use it.
Is my trip computer accurate?
It is a calculated estimate, generally optimistic, and it can read differently after a software change because the underlying fuelling assumptions moved. For a real comparison, use fuel actually put into the tank over measured miles.
Why is my van’s economy so much worse than the official figure?
Official figures come from a standardised test cycle with no load, no roof rack and no traffic. A working van carries weight, stops constantly and rarely reaches the steady conditions the test uses. The Vehicle Certification Agency is the body to contact if you believe a vehicle genuinely cannot meet its stated performance.
Economy gone the wrong way? Get it diagnosed before you blame the map
We diagnose fuelling, boost and after-treatment faults on cars and vans across Staffordshire and Cheshire, and we will tell you honestly when the answer is a repair rather than a remap.
About the author. Reviewed and signed off by Pro Remapping. We write custom ECU calibrations and diagnose diesel fuelling, boost and after-treatment faults on cars, vans and light commercials every week.
Official fuel consumption figures are produced under standardised test conditions and are not a prediction of real-world results. We do not quote guaranteed economy or power figures, because outcomes vary by engine, condition and driving style; any price is given per vehicle after inspection and is not a quotation until confirmed.


